Solutions
Assign team Onboarding plan Knowledge acquisition
- Determine roles/skills
- Assess skills
- Location requirements
- Assign team
- Onboarding plan
- Knowledge acquisition
25+
years in business
1000+
projects completed
95%
client retention
10
global locations
2000+
global employees

On the Planet Fitness App you can access exclusive training series, powered by iFit.


Enhancing operational efficiency and cost savings through cloud-based management.

From a product company to a software platform provider.


From strength machines to digital solutions, a journey to personalized workouts.


Story of 11 years of partnership.

Coherent Solutions takes pride in our clients' success. Learn how our collaboration can drive your business results in selected stories of partnership.
Partnership
The foundation of all engagements, Partnership encompasses the vital aspects of Engagement Health, Team Health, Strategic Plans, and Assessing Impact. By fostering a strong collaboration as a digital product engineering partner, we ensure a collaborative and transparent relationship with our clients, focusing on shared goals and objectives.
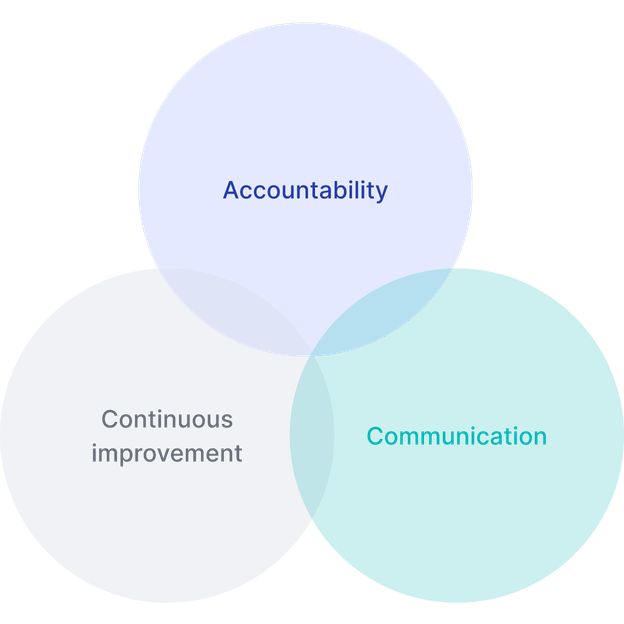
Governance
Sitting atop the Partnership, Governance establishes a framework for success through Accountability, Communication, and Continuous Improvement. By defining clear roles, responsibilities, and communication channels, we ensure streamlined operations and effective decision-making throughout the engagement.
Engagement
Consisting of three key steps, Engagement is where the work is done to turn vision into reality.
Assign team Onboarding plan Knowledge acquisition
As a leading digital product engineering company, we go beyond creating custom software; we provide industry-specific product engineering consulting services, guiding you through the entire development lifecycle, from the initial concept to the final product.
Schedule a consultation


We take every client relationship seriously, and consider our team an extension of your business as digital product engineering company.
Simply fill out our contact form below, and we will reach out to you within 1 business day to schedule a free 1-hour consultation covering platform selection, budgeting, and project timelines.